

Last Updated: October 29, 2026
Quick Summary
To improve retail store layout efficiency, first measure footfall, conversion, and sales per square foot by zone, then map customer flow to find bottlenecks and dead zones. Pick a layout type that fits your shoppers, place high-value products in visible spots, and test changes in one small zone before rolling them out.
- Measure footfall, conversion, and sales per square foot by zone before moving any fixtures.
- Build the baseline across weekdays and weekends so peak-period bottlenecks are not missed.
- Choose a grid, free-flow, or hybrid layout based on whether shoppers come to buy or browse.
- Place high-margin products at eye level near the entrance, and shrink zones that earn little revenue.
- Measure restock travel time as well, since a layout that slows staff can undo its shopper gains.
Table of Contents
- Why Store Layout Efficiency Matters for Sales and Staffing
- Step 1: Measure Customer Traffic and Footfall Before Changing Anything
- Step 2: Map Customer Flow and Identify Bottlenecks and Dead Zones
- Step 3: Choose a Layout Type: Grid, Free-Flow, or Hybrid
- Step 4: Optimize Floor Space and Product Visibility
- Step 5: Balance Shopper Access with Staff Efficiency and Replenishment
- Booking a Layout Review and Starting Your First Test Zone
- Frequently Asked Questions
Why Store Layout Efficiency Matters for Sales and Staffing
Retail store layout is one of the few levers you control completely. Where shoppers walk, what they see first, and how easily they reach the register all shape sales and staffing needs.
A poor layout costs money in two directions. Shoppers who wander without purpose leave without buying, and staff spend hours restocking the wrong zones or answering questions that clear signage would have solved. A good layout does the opposite.
Efficiency here means three things:
- Sales efficiency: more purchases per visit and more sales per square foot
- Space efficiency: every fixture earns its place on the floor
- Labor efficiency: staff spend time serving customers, not working around congestion
The steps below walk through a practical process. Measure first, then map, then choose a layout, then refine product placement, and finally balance access with staffing. Skipping the measurement step is the most common mistake.
Step 1: Measure Customer Traffic and Footfall Before Changing Anything
Start by measuring how people actually move through your store. Guessing based on how the floor looks on paper rarely matches real behavior. The difference between a layout change that works and one that just moves the problem is a baseline you can compare against later.
What to track, and how to calculate it:
| Metric | Formula | What a healthy pattern looks like |
|---|---|---|
| Footfall | People entering per hour, counted at the door | Peaks that match your staffing schedule |
| Conversion rate | Transactions ÷ footfall × 100 | Stable or rising after a layout change |
| Sales per square foot | Zone revenue ÷ zone floor area (sq ft) | Top-quartile zones earn 2-3× the store average |
| Dwell time | Minutes in a zone, from observation or sensor data | Longer in browse zones, shorter in grab-and-go |
| Capture rate by zone | Shoppers who stop in a zone ÷ shoppers who pass | Low capture flags a visibility problem |
| Restock travel time | Minutes per restock trip × trips per day | Falling after fixture or backroom changes |
Build the baseline in four steps:
- Pick sample blocks. Count in 15-minute blocks at the top of each hour across opening, midday, and close, on at least two weekdays and both weekend days. Rotate the observer so one person's bias does not shape the whole dataset.
- Count at the door and at zone boundaries. A door counter or overhead sensor handles footfall; manual tally sheets handle zone entry and stop rates. If you use sensors, reconcile the count against a manual tally once per week.
- Pull point-of-sale data by zone. Map SKUs to zones so revenue and units sold line up with the physical map you will draw in Step 2. Without that mapping, sales per square foot by zone is guesswork.
- Record the baseline before you move a single fixture. Write the numbers down with dates, weather notes, and any promotions running. A baseline taken during a sale event will mislead every later comparison.
Set targets before you change anything. Pick targets that fit your baseline rather than copying someone else's numbers; a store already converting well has less headroom than one with obvious dead zones.
Step 2: Map Customer Flow and Identify Bottlenecks and Dead Zones
Once you have traffic data, draw a simple map of the store. Mark where people enter, where they stop, and where they leave the path.
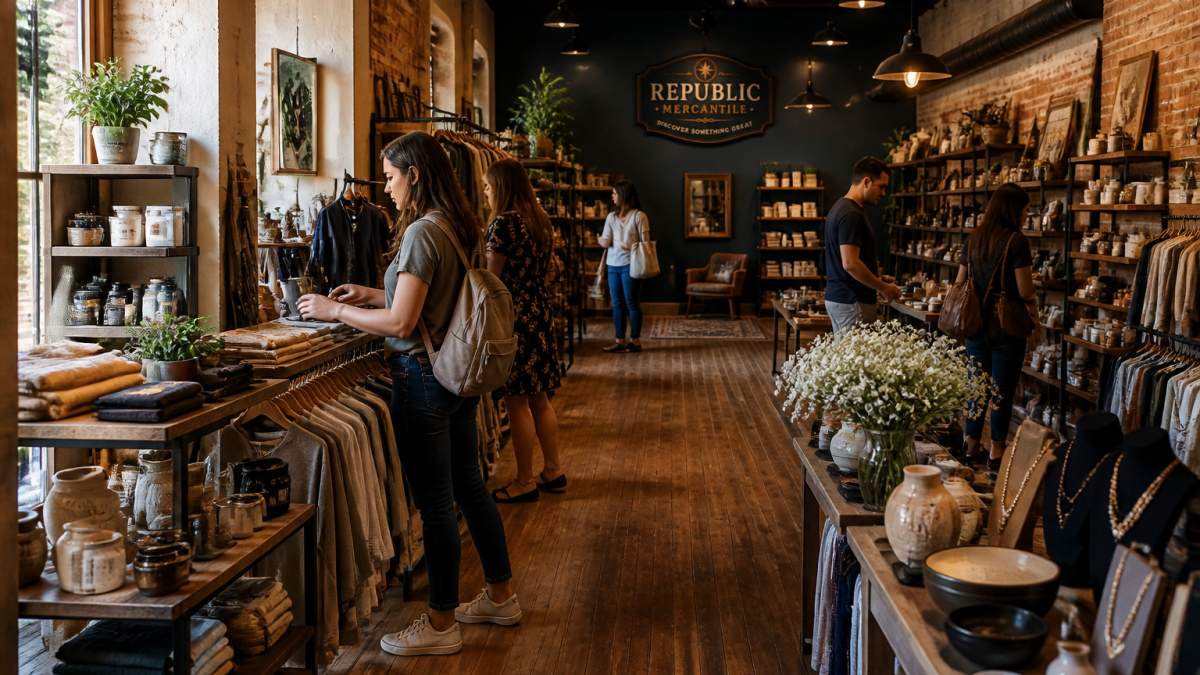
Look for two problem types:
| Problem | What It Looks Like | Common Fix |
|---|---|---|
| Bottleneck | Crowding at a narrow aisle, entrance, or checkout line | Widen the path, move a fixture, add a second register |
| Dead zone | Corners or back walls that few shoppers visit | Move a popular product there, add a display, or reduce space |
Questions to answer on the map:
- Do shoppers reach the back of the store, or do they turn around early?
- Do aisles feel cramped during peak times?
- Are high-demand products placed where people must walk past the rest of the store?
- Does the entrance give people a clear first direction?
A quiet corner in the back is not always a failure. Some stores use these areas for calmer browsing or fitting rooms. The test is whether the space earns its footprint in sales or service.
Step 3: Choose a Layout Type: Grid, Free-Flow, or Hybrid
The overall layout type sets the structure for everything else. Most stores use one of three models.
Grid layout Shelves and fixtures run in straight, parallel rows. This works well for everyday goods where shoppers know what they want.
- Pros: easy to navigate, efficient use of space, simple to restock
- Cons: can feel rigid, and shoppers may walk past products without browsing
Free-flow layout Fixtures are placed in open, curved, or irregular patterns. This suits stores built around browsing and discovery.
- Pros: encourages exploration, creates a relaxed feel
- Cons: harder to scan quickly, can waste floor space, harder for staff to keep organized
Hybrid layout A grid for core, predictable categories and a free-flow area for featured or rotating products. Many stores with mixed inventory find this approach balances speed and discovery.
- Pros: serves both quick shoppers and browsers, flexible for new items
- Cons: more complex to plan and maintain
Choose based on your data from Step 1. If most shoppers come in for specific items, lean toward a grid. If dwell time is high and shoppers browse widely, a free-flow or hybrid model may pay off.
Step 4: Optimize Floor Space and Product Visibility
Once the layout type is set, focus on how products are shown.
Place high-value items in visible zones. Shoppers tend to notice products at eye level and near the entrance. Put high-margin or featured goods in these spots.
Use displays to guide movement. A well-placed end-cap or table can pull shoppers into an aisle they would otherwise skip.
Match space to sales. Compare sales per square foot across zones.
Keep sightlines open. Tall fixtures at the front block views of the back of the store.
- Group related products together so shoppers find complementary items
- Keep signage simple and readable from a few steps away
- Review placement monthly using sales data from each zone
Step 5: Balance Shopper Access with Staff Efficiency and Replenishment
A layout that looks good for shoppers can still fail if staff cannot maintain it.
Measure the labor side before you change fixtures:
- Restock travel time: time one full restock trip from the backroom to the shelf, then multiply by trips per day. A poorly placed fast-mover can add minutes to each trip, which compounds across a shift.
- Picking and put-away distance: walk the path a stocker takes for your top 20 SKUs. If the top sellers sit far from storage, every replenishment cycle pays a travel tax.
- Service coverage: count how often a register or department sits unattended during peak hours. Layout that pulls staff into long restocks reduces coverage exactly when shoppers need help.
- Out-of-stock frequency by zone: empty shelves undo good layouts quickly, and they usually trace back to a restock path that is too slow or too far.
Design the back-of-house workflow around the floor:
- Put fast movers near their storage. High-velocity SKUs should be reachable in minutes, not require a cross-store walk. If you cannot move the product, move the overflow storage closer.
- Separate restock routes from shopper routes. Plan back-of-house paths so staff can reach shelves without crossing the busiest aisles during peak periods. Narrow stock corridors add time to every restock and create collisions with shoppers.
- Stage replenishment by zone. Batch restocks so one trip covers a full zone rather than one shelf. Zone-based staging cuts travel more reliably than asking staff to move faster.
- Set a replenishment cadence by velocity. Fast sellers get frequent, short restocks; slow sellers get scheduled deeper restocks. Matching cadence to velocity keeps shelves full without overstaffing.
- Keep displays at a maintainable stock level. Full shelves look appealing, but overfilled displays slow staff and confuse shoppers. Aim for a clean, consistent level that one person can maintain during a shift.
Test changes with a small zone first. Pick one area, make the change, and measure results for two weeks before rolling it out. This controlled approach shows whether the new layout improves both sales and staff workload, and it limits disruption if the change underperforms.
Track these measures after each change:
- Sales per square foot in the changed zone
- Dwell time and conversion rate
- Restock travel time and trips per day
- Time spent answering questions that signage could have prevented
- Out-of-stock frequency by zone
Booking a Layout Review and Starting Your First Test Zone
Start small. Choose one zone with clear data showing a problem, such as a dead corner or a congested aisle. Apply one change, measure it against your baseline, and decide what to do next based on the results.
If you want a second opinion on your store plan, Republic Mercantile can help you think through your options. Pricing for any layout review depends on store size, scope, and timing, so contact us directly for a current quote. Get started with a review of your highest-traffic zone and build from there.
Frequently Asked Questions
How do you measure retail space efficiency?
Start with sales per square foot, dwell time in each zone, and conversion rate by department. Compare these numbers for a baseline period before changing the layout, then repeat the same measurements after the change for the same length of time. Pair the sales data with traffic counts from door sensors or video so you can tell whether a zone is underperforming because few shoppers reach it or because shoppers reach it and do not buy. Recording these KPIs in a simple spreadsheet is enough for most stores to see whether a change worked.
How often should a retail store layout be reviewed?
Review the layout at least twice a year and after any major change in inventory, such as a new product category or a seasonal assortment shift. Also review it after the store sees a sustained drop in sales per square foot or when staff report recurring congestion at the same spot. Scheduled reviews keep the floor plan aligned with how shoppers actually move through the store rather than how it was first designed.
How should products be placed in a retail store?
Place high-margin and frequently purchased items where traffic is highest, usually along the path shoppers take from the entrance and near the register. Use eye-level shelving for products you most want to sell and keep impulse items near checkout. Group related products together so shoppers can find them quickly, and avoid placing heavy or bulky items where they block the main aisle. Adjust placement after reviewing zone performance data rather than relying on intuition alone.
How can store layout improve customer flow?
A layout improves customer flow when the main aisle is wide enough for two shoppers to pass comfortably, and when the path leads naturally past key displays without forcing a detour. Remove fixtures that create pinch points near the entrance, and use sightlines and signage to pull shoppers toward less-visited areas. Monitoring traffic before and after a change shows whether shoppers are reaching the back of the store more often.
